Total Near Earth Asteroids’ Observations: 975

May 2025 - May 2026

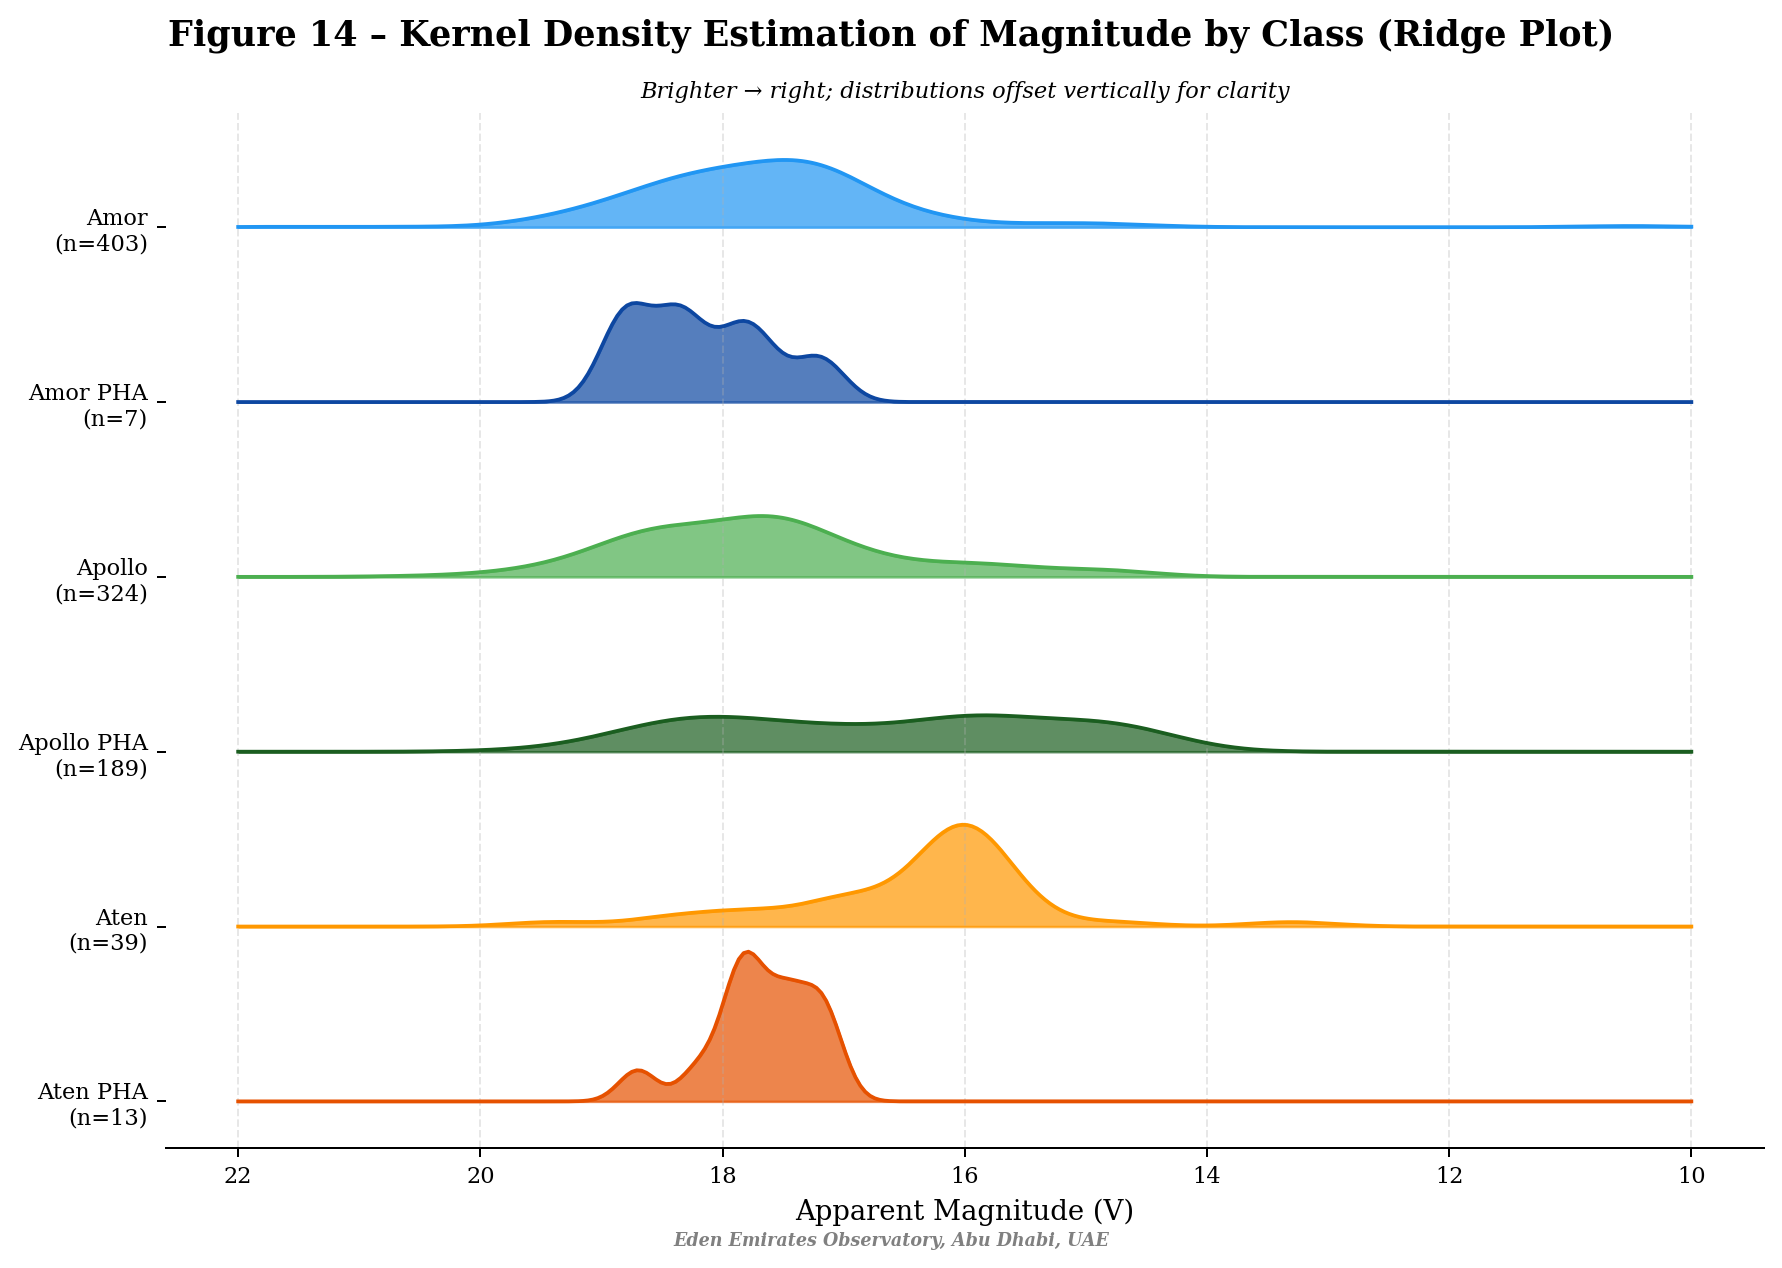
A ridge plot showing kernel density estimates of apparent magnitudes for different star classes observed at the Eden Emirates Observatory in Abu Dhabi, UAE. The plot includes classes Amor, Amor PHA, Apollo, Apollo PHA, Aten, and Aten PHA, each represented by colored density curves. The data counts are indicated next to each class, with apparent magnitude on the x-axis ranging from 22 to 10. Brighter objects are on the right.
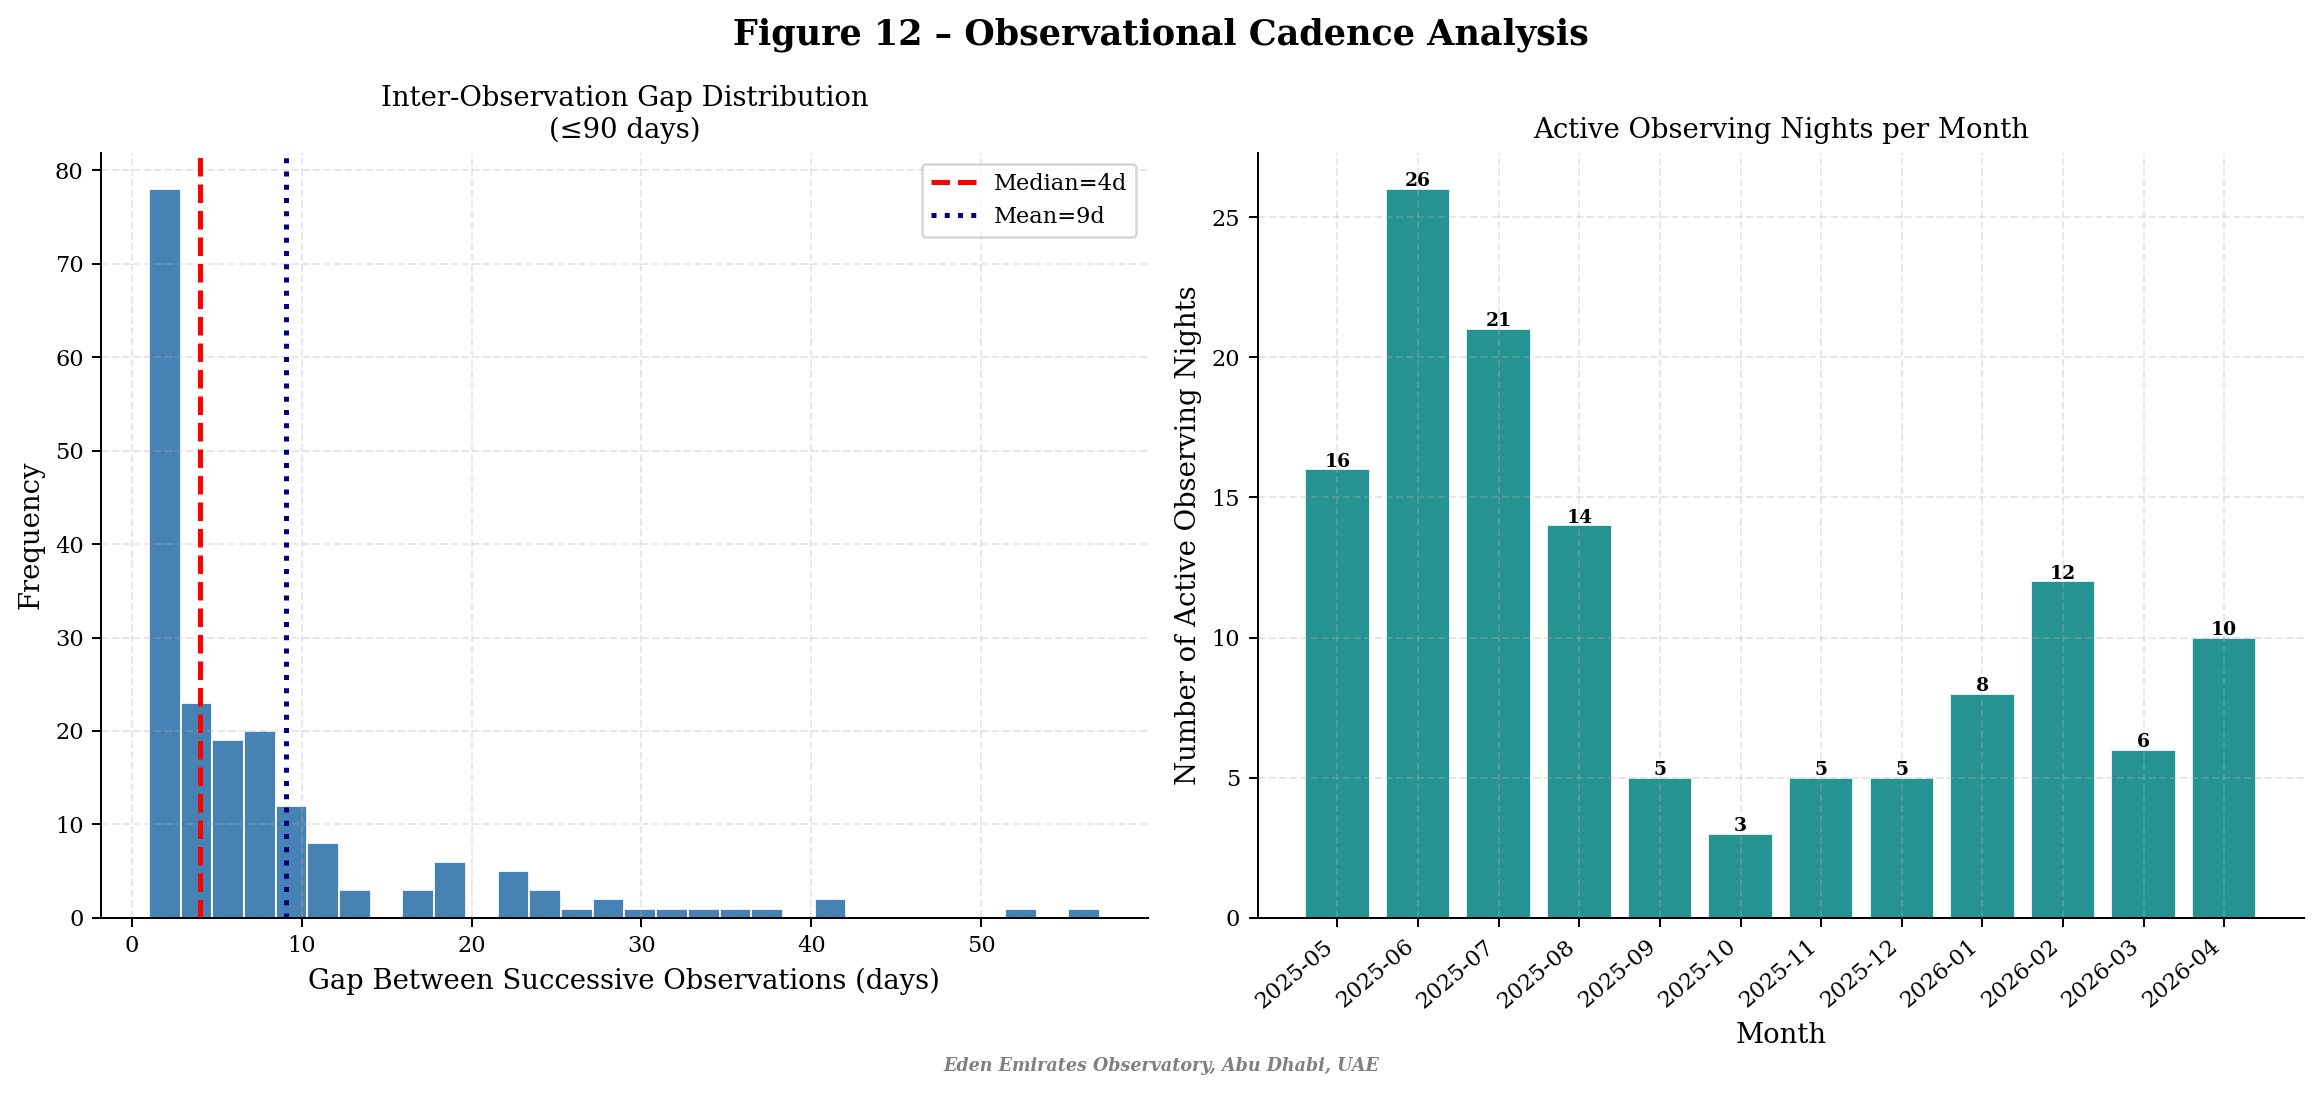
Graph showing observational cadence analysis with two bar charts. The left bar chart displays inter-observation gap distribution with red dashed line indicating median of 4 days and blue dotted line indicating mean of 9 days. The right bar chart shows active observing nights per month with varying counts from May 2025 to April 2026, with the peak at 26 nights in May 2025.
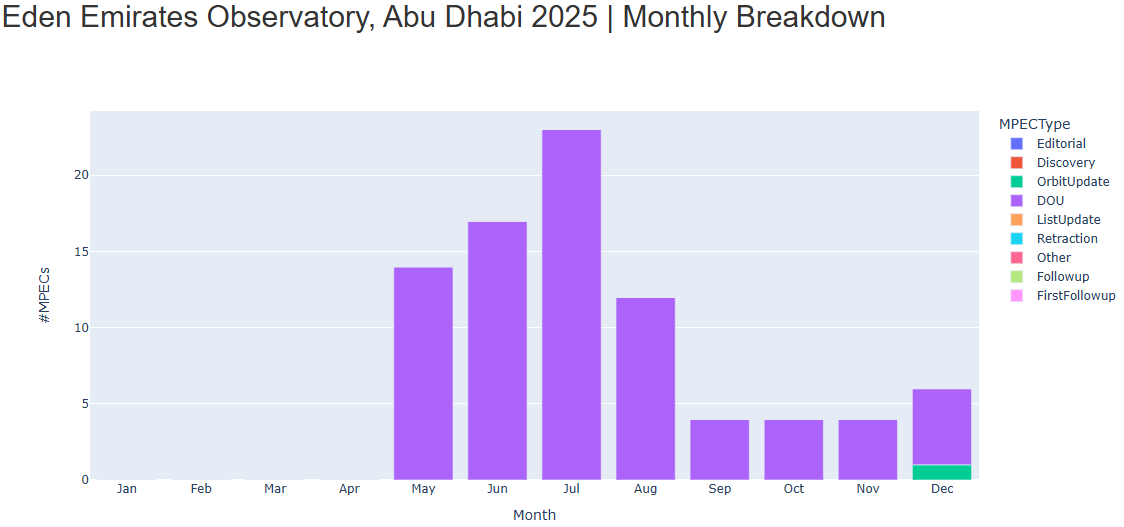
Monthly breakdown chart of MPETypes at Eden Emirates Observatory, Abu Dhabi in 2025, showing peak in June and declining afterwards, with data for each month from April to December.
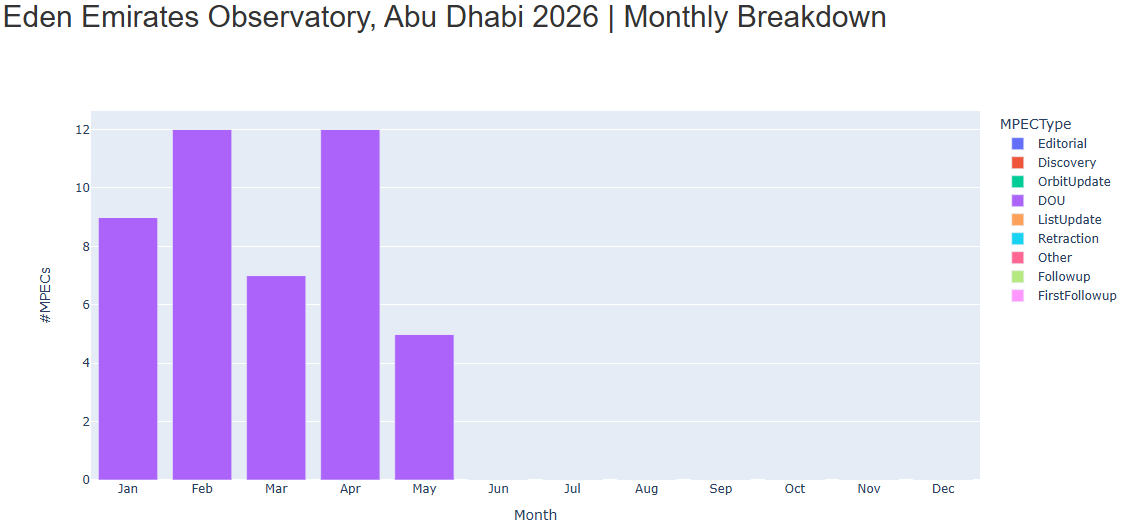
Bar chart illustrating monthly breakdown of MPECs at Eden Emirates Observatory, Abu Dhabi, 2026, with purple bars representing DOU MPECs, showing the highest counts in February and April.